
Dosya:Plplot.png

Daha yüksek çözünürlüğe sahip sürüm bulunmamaktadır.
Plplot.png ((800 × 600 piksel, dosya boyutu: 242 KB, MIME tipi: image/png))
Bu dosya Wikimedia Commons'ta bulunmaktadır. Dosyanın açıklaması aşağıda gösterilmiştir. Commons, serbest/özgür telifli medya dosyalarının bulundurulduğu depodur. Siz de yardım edebilirsiniz. |
Özet
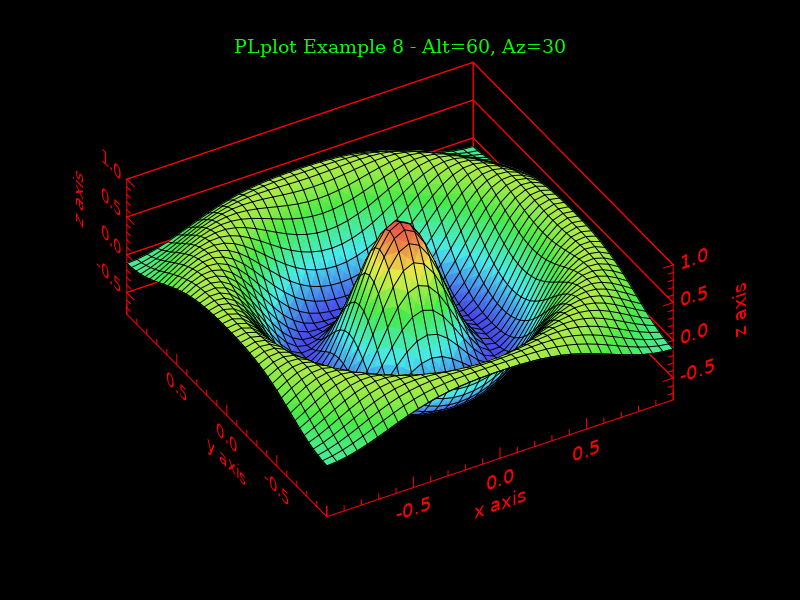
| Açıklama | Example PLplot image |
| Tarih | 05/06/09 |
| Kaynak | http://plplot.sourceforge.net/examples-data/demo08/x08.03.png |
| Yazar | PLplot project |
Lisanslama

|
Bu kütüphane bir özgür yazılımdır; Özgür Yazılım Vakfı tarafından yayınlanan GNU Daha Küçük Genel Kamu Lisansı altında veya sürüm 2.1 lisansı ya da sonraki herhangi bir lisan sürümünü (sizin seçiminize göre) seçerek; bu kütüphaneyi dağıtabilir ve/veya değiştirebilirsiniz. Bu kütüphane faydalı olacağı ümidiyle, ancak belirli bir amaç için uygunluk veya ticari bir amaç dahil olmak üzere herhangi bir garanti verilmeden dağıtılmıştır. Detaylı bilgi için sürüm 2 ve GNU Gene Kamu Lisansı sürüm 3 sayfalarına bakabilirsiniz. |
c src code
// https://plplot.sourceforge.net/examples.php?demo=08
//      3-d plot demo.
//
// Copyright (C) 2004  Alan W. Irwin
// Copyright (C) 2004  Rafael Laboissiere
//
// This file is part of PLplot.
//
// PLplot is free software; you can redistribute it and/or modify
// it under the terms of the GNU Library General Public License as published
// by the Free Software Foundation; either version 2 of the License, or
// (at your option) any later version.
//
// PLplot is distributed in the hope that it will be useful,
// but WITHOUT ANY WARRANTY; without even the implied warranty of
// MERCHANTABILITY or FITNESS FOR A PARTICULAR PURPOSE.  See the
// GNU Library General Public License for more details.
//
// You should have received a copy of the GNU Library General Public License
// along with PLplot; if not, write to the Free Software
// Foundation, Inc., 51 Franklin Street, Fifth Floor, Boston, MA 02110-1301 USA
//
//
//

#include "plcdemos.h"

// plexit not declared in public header!  However, explicit
// declaration (commented out below) does not work for g++ compiler
// (used for non-dynamic and static cases) for unknown reasons.  So
// use private header instead to declare plexit (which does work).
//PLDLLIMPEXP void
//plexit( PLCHAR_VECTOR errormsg );
#include "plplotP.h"

// These values must be odd, for the middle
// of the index range to be an integer, and thus
// to correspond to the exact floating point centre
// of the sombrero.
#define XPTS    35              // Data points in x
#define YPTS    45              // Data points in y

static PLFLT alt[] = { 60.0, 40.0 };
static PLFLT az[] = { 30.0, -30.0 };
static void cmap1_init( int );

static PLCHAR_VECTOR title[] =
{
    "#frPLplot Example 8 - Alt=60, Az=30",
    "#frPLplot Example 8 - Alt=40, Az=-30",
};

//--------------------------------------------------------------------------
// cmap1_init1
//
// Initializes color map 1 in HLS space.
// Basic grayscale variation from half-dark (which makes more interesting
// looking plot compared to dark) to light.
// An interesting variation on this:
//	s[1] = 1.0
//--------------------------------------------------------------------------

static void
cmap1_init( int gray )
{
    PLFLT i[2], h[2], l[2], s[2];

    i[0] = 0.0;         // left boundary
    i[1] = 1.0;         // right boundary

    if ( gray )
    {
        h[0] = 0.0;     // hue -- low: red (arbitrary if s=0)
        h[1] = 0.0;     // hue -- high: red (arbitrary if s=0)

        l[0] = 0.5;     // lightness -- low: half-dark
        l[1] = 1.0;     // lightness -- high: light

        s[0] = 0.0;     // minimum saturation
        s[1] = 0.0;     // minimum saturation
    }
    else
    {
        h[0] = 240; // blue -> green -> yellow ->
        h[1] = 0;   // -> red

        l[0] = 0.6;
        l[1] = 0.6;

        s[0] = 0.8;
        s[1] = 0.8;
    }

    plscmap1n( 256 );
    c_plscmap1l( 0, 2, i, h, l, s, NULL );
}

//--------------------------------------------------------------------------
// main
//
// Does a series of 3-d plots for a given data set, with different
// viewing options in each plot.
//--------------------------------------------------------------------------


static int           rosen;
static int           if_plfsurf3d;

static PLOptionTable options[] = {
    {
        "rosen",             // Turns on use of Rosenbrock function
        NULL,
        NULL,
        &rosen,
        PL_OPT_BOOL,
        "-rosen",
        "Use the log_e of the \"Rosenbrock\" function"
    },
    {
        "if_plfsurf3d",
        NULL,
        NULL,
        &if_plfsurf3d,
        PL_OPT_BOOL,
        "-if_plfsurf3d",
        "Use C-only plfsurf3d API rather then usual cross-language plsurf3d API"
    },
    {
        NULL,                   // option
        NULL,                   // handler
        NULL,                   // client data
        NULL,                   // address of variable to set
        0,                      // mode flag
        NULL,                   // short syntax
        NULL
    }                           // long syntax
};

#define LEVELS    10

int
main( int argc, char *argv[] )
{
    int      i, j, k;
    PLFLT    *x, *y, **z;
    // Shut up spurious undefined warnings from the compiler.
    PLFLT    *z_row_major = NULL, *z_col_major = NULL;
    PLFLT    dx           = 2. / (PLFLT) ( XPTS - 1 );
    PLFLT    dy           = 2. / (PLFLT) ( YPTS - 1 );
    PLfGrid2 grid_c, grid_row_major, grid_col_major;
    PLFLT    xx, yy, r;
    PLINT    ifshade;
    PLFLT    zmin, zmax, step;
    PLFLT    clevel[LEVELS];
    PLINT    nlevel = LEVELS;

    PLINT    indexxmin = 0;
    PLINT    indexxmax = XPTS;
    PLINT    *indexymin;
    PLINT    *indexymax;
    PLFLT    **zlimited;
    // parameters of ellipse (in x, y index coordinates) that limits the data.
    // x0, y0 correspond to the exact floating point centre of the index
    // range.
    PLFLT x0 = 0.5 * (PLFLT) ( XPTS - 1 );
    PLFLT a  = 0.9 * x0;
    PLFLT y0 = 0.5 * (PLFLT) ( YPTS - 1 );
    PLFLT b  = 0.7 * y0;
    PLFLT square_root;

    // Parse and process command line arguments
    plMergeOpts( options, "x08c options", NULL );
    (void) plparseopts( &argc, argv, PL_PARSE_FULL );

    // Initialize plplot

    plinit();

// Allocate data structures

    x = (PLFLT *) calloc( XPTS, sizeof ( PLFLT ) );
    y = (PLFLT *) calloc( YPTS, sizeof ( PLFLT ) );

    plAlloc2dGrid( &z, XPTS, YPTS );
    if ( if_plfsurf3d )
    {
        z_row_major = (PLFLT *) malloc( XPTS * YPTS * sizeof ( PLFLT ) );
        z_col_major = (PLFLT *) malloc( XPTS * YPTS * sizeof ( PLFLT ) );
        if ( !z_row_major || !z_col_major )
            plexit( "Memory allocation error" );

        grid_c.f         = z;
        grid_row_major.f = (PLFLT **) z_row_major;
        grid_col_major.f = (PLFLT **) z_col_major;
        grid_c.nx        = grid_row_major.nx = grid_col_major.nx = XPTS;
        grid_c.ny        = grid_row_major.ny = grid_col_major.ny = YPTS;
    }

    for ( i = 0; i < XPTS; i++ )
    {
        x[i] = -1. + (PLFLT) i * dx;
        if ( rosen )
            x[i] *= 1.5;
    }

    for ( j = 0; j < YPTS; j++ )
    {
        y[j] = -1. + (PLFLT) j * dy;
        if ( rosen )
            y[j] += 0.5;
    }

    for ( i = 0; i < XPTS; i++ )
    {
        xx = x[i];
        for ( j = 0; j < YPTS; j++ )
        {
            yy = y[j];
            if ( rosen )
            {
                z[i][j] = pow( 1. - xx, 2. ) + 100. * pow( yy - pow( xx, 2. ), 2. );

                // The log argument might be zero for just the right grid.
                if ( z[i][j] > 0. )
                    z[i][j] = log( z[i][j] );
                else
                    z[i][j] = -5.; // -MAXFLOAT would mess-up up the scale
            }
            else
            {
                r       = sqrt( xx * xx + yy * yy );
                z[i][j] = exp( -r * r ) * cos( 2.0 * M_PI * r );
            }

            if ( if_plfsurf3d )
            {
                z_row_major[i * YPTS + j] = z[i][j];
                z_col_major[i + XPTS * j] = z[i][j];
            }
        }
    }

    // Allocate and calculate y index ranges and corresponding zlimited.
    plAlloc2dGrid( &zlimited, XPTS, YPTS );
    indexymin = (PLINT *) malloc( XPTS * sizeof ( PLINT ) );
    indexymax = (PLINT *) malloc( XPTS * sizeof ( PLINT ) );
    if ( !indexymin || !indexymax )
        plexit( "Memory allocation error" );

    //printf("XPTS = %d\n", XPTS);
    //printf("x0 = %f\n", x0);
    //printf("a = %f\n", a);
    //printf("YPTS = %d\n", YPTS);
    //printf("y0 = %f\n", y0);
    //printf("b = %f\n", b);

    // These values should all be ignored because of the i index range.
#if 0
    for ( i = 0; i < indexxmin; i++ )
    {
        indexymin[i] = 0;
        indexymax[i] = YPTS;
        for ( j = indexymin[i]; j < indexymax[i]; j++ )
            // Mark with large value to check this is ignored.
            zlimited[i][j] = 1.e300;
    }
#endif
    for ( i = indexxmin; i < indexxmax; i++ )
    {
        square_root = sqrt( 1. - MIN( 1., pow( ( i - x0 ) / a, 2. ) ) );
        // Add 0.5 to find nearest integer and therefore preserve symmetry
        // with regard to lower and upper bound of y range.
        indexymin[i] = MAX( 0, (PLINT) ( 0.5 + y0 - b * square_root ) );
        // indexymax calculated with the convention that it is 1
        // greater than highest valid index.
        indexymax[i] = MIN( YPTS, 1 + (PLINT) ( 0.5 + y0 + b * square_root ) );
        //printf("i, b*square_root, indexymin[i], YPTS - indexymax[i] = %d, %e, %d, %d\n", i, b*square_root, indexymin[i], YPTS - indexymax[i]);

#if 0
        // These values should all be ignored because of the j index range.
        for ( j = 0; j < indexymin[i]; j++ )
            // Mark with large value to check this is ignored.
            zlimited[i][j] = 1.e300;
#endif

        for ( j = indexymin[i]; j < indexymax[i]; j++ )
            zlimited[i][j] = z[i][j];

#if 0
        // These values should all be ignored because of the j index range.
        for ( j = indexymax[i]; j < YPTS; j++ )
            // Mark with large value to check this is ignored.
            zlimited[i][j] = 1.e300;
#endif
    }

#if 0
    // These values should all be ignored because of the i index range.
    for ( i = indexxmax; i < XPTS; i++ )
    {
        indexymin[i] = 0;
        indexymax[i] = YPTS;
        for ( j = indexymin[i]; j < indexymax[i]; j++ )
            // Mark with large value to check this is ignored.
            zlimited[i][j] = 1.e300;
    }
#endif

    plMinMax2dGrid( (PLFLT_MATRIX) z, XPTS, YPTS, &zmax, &zmin );
    step = ( zmax - zmin ) / ( nlevel + 1 );
    for ( i = 0; i < nlevel; i++ )
        clevel[i] = zmin + step + step * i;

    pllightsource( 1., 1., 1. );

    for ( k = 0; k < 2; k++ )
    {
        for ( ifshade = 0; ifshade < 5; ifshade++ )
        {
            pladv( 0 );
            plvpor( 0.0, 1.0, 0.0, 0.9 );
            plwind( -1.0, 1.0, -0.9, 1.1 );
            plcol0( 3 );
            plmtex( "t", 1.0, 0.5, 0.5, title[k] );
            plcol0( 1 );
            if ( rosen )
                plw3d( 1.0, 1.0, 1.0, -1.5, 1.5, -0.5, 1.5, zmin, zmax, alt[k], az[k] );
            else
                plw3d( 1.0, 1.0, 1.0, -1.0, 1.0, -1.0, 1.0, zmin, zmax, alt[k], az[k] );

            plbox3( "bnstu", "x axis", 0.0, 0,
                "bnstu", "y axis", 0.0, 0,
                "bcdmnstuv", "z axis", 0.0, 0 );
            plcol0( 2 );

            if ( ifshade == 0 ) // diffuse light surface plot
            {
                cmap1_init( 1 );
                if ( if_plfsurf3d )
                    plfsurf3d( x, y, plf2ops_c(), (PLPointer) z, XPTS, YPTS, 0, NULL, 0 );
                else
                    plsurf3d( x, y, (PLFLT_MATRIX) z, XPTS, YPTS, 0, NULL, 0 );
            }
            else if ( ifshade == 1 ) // magnitude colored plot
            {
                cmap1_init( 0 );
                if ( if_plfsurf3d )
                    plfsurf3d( x, y, plf2ops_grid_c(), ( PLPointer ) & grid_c, XPTS, YPTS, MAG_COLOR, NULL, 0 );
                else
                    plsurf3d( x, y, (PLFLT_MATRIX) z, XPTS, YPTS, MAG_COLOR, NULL, 0 );
            }
            else if ( ifshade == 2 ) //  magnitude colored plot with faceted squares
            {
                cmap1_init( 0 );
                if ( if_plfsurf3d )
                    plfsurf3d( x, y, plf2ops_grid_row_major(), ( PLPointer ) & grid_row_major, XPTS, YPTS, MAG_COLOR | FACETED, NULL, 0 );
                else
                    plsurf3d( x, y, (PLFLT_MATRIX) z, XPTS, YPTS, MAG_COLOR | FACETED, NULL, 0 );
            }
            else if ( ifshade == 3 ) // magnitude colored plot with contours
            {
                cmap1_init( 0 );
                if ( if_plfsurf3d )
                    plfsurf3d( x, y, plf2ops_grid_col_major(), ( PLPointer ) & grid_col_major, XPTS, YPTS, MAG_COLOR | SURF_CONT | BASE_CONT, clevel, nlevel );
                else
                    plsurf3d( x, y, (PLFLT_MATRIX) z, XPTS, YPTS, MAG_COLOR | SURF_CONT | BASE_CONT, clevel, nlevel );
            }
            else // magnitude colored plot with contours and index limits.
            {
                cmap1_init( 0 );
                plsurf3dl( x, y, (PLFLT_MATRIX) zlimited, XPTS, YPTS, MAG_COLOR | SURF_CONT | BASE_CONT, clevel, nlevel, indexxmin, indexxmax, indexymin, indexymax );
            }
        }
    }

// Clean up

    free( (void *) x );
    free( (void *) y );
    plFree2dGrid( z, XPTS, YPTS );
    if ( if_plfsurf3d )
    {
        free( (void *) z_row_major );
        free( (void *) z_col_major );
    }

    plFree2dGrid( zlimited, XPTS, YPTS );
    free( (void *) indexymin );
    free( (void *) indexymax );

    plend();

    exit( 0 );
}
Orijinal yükleme günlüğü
Dosyanın orjinal açıklama sayfası burada bulunmaktadır. Aşağıdaki tüm kullanıcı adları için en.wikipedia bakın.
| Tarih/Saat | Boyutlar | Kullanıcı | Yorum |
|---|---|---|---|
| 2009-06-05 10:18:38 | 800 × 600 | CharlesC | {{Information |Description = Example PLplot image |Source = [http://plplot.sourceforge.net/examples-data/demo08/x08.03.png] |Date = 05/06/09 |Author = PLplot project }} |
Dosya geçmişi
Dosyanın herhangi bir zamandaki hâli için ilgili tarih/saat kısmına tıklayın.
| Tarih/Saat | Küçük resim | Boyutlar | Kullanıcı | Yorum | |
|---|---|---|---|---|---|
| güncel | 09.32, 11 Şubat 2017 | | 800 × 600 (242 KB) | FastilyClone | Transferred from en.wikipedia (MTC!) |
Dosya kullanımı
Bu görüntü dosyasına bağlantısı olan sayfalar:
Küresel dosya kullanımı
Aşağıdaki diğer vikiler bu dosyayı kullanmaktadır:
- en.wikipedia.org üzerinde kullanımı
- hu.wikipedia.org üzerinde kullanımı
- www.wikidata.org üzerinde kullanımı