
Dosya:All palaeotemps.svg

Bu dosya Wikimedia Commons'ta bulunmaktadır. Dosyanın açıklaması aşağıda gösterilmiştir. Commons, serbest/özgür telifli medya dosyalarının bulundurulduğu depodur. Siz de yardım edebilirsiniz. |
Özet
| Açıklama |
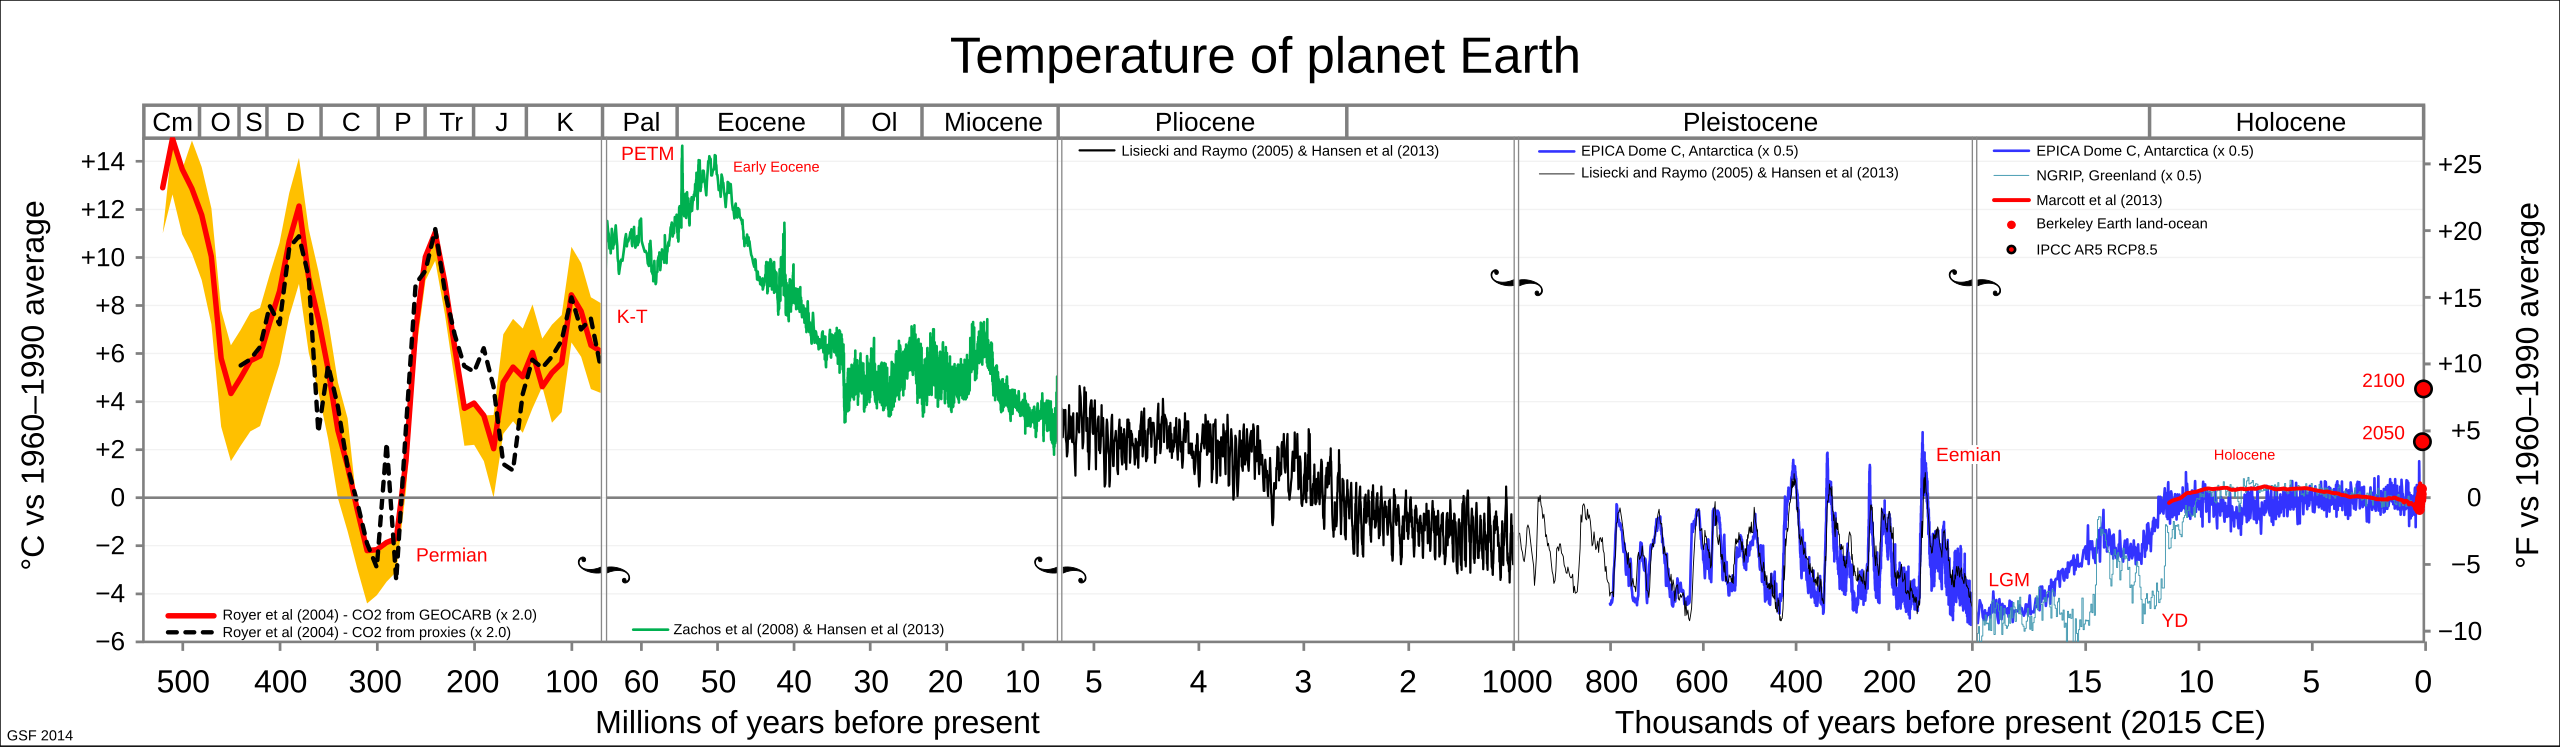
English: Global average temperature estimates for the last 540 My |
| Kaynak | Yükleyenin kendi çalışması; data sources are cited below |
| Yazar | Glen Fergus |
| Diğer sürümler |
File:All palaeotemps.svg contains 2 translations.
|
| SVG gelişimi |


Özet
This shows estimates of global average surface air temperature over the ~540 My of the Phanerozoic Eon, since the first major proliferation of complex life forms on our planet. A substantial achievement of the last 30 years of climate science has been the production of a large set of actual measurements of temperature history (from physical proxies), replacing much of the earlier geological induction (i.e. informed guesses). The graph shows selected proxy temperature estimates, which are detailed below.
Because many proxy temperature reconstructions indicate local, not global, temperature -- or ocean, not air, temperature -- substantial approximation may be involved in deriving these global temperature estimates. As a result, the relativities of some of the plotted estimates are approximate, particularly the early ones.
Time scale
Time is plotted forward to the present, taken as 2015 CE. It joins five separate linearly scaled segments, expanding by about an order of magnitude at each vertical break. The breaks are not evenly distributed; rather they are positioned at geologically relevant times:
- At the Mesozoic – Cenozoic boundary, ~65 My ago. This is the "K-T" boundary (now called "Cretaceous–Paleogene"), at which the dinosaurs became extinct.
- At the Miocene – Pliocene boundary, ~5.3 My ago.
- One million years ago, near the onset of the current, 100,000 year-dominated, glaciation cycle (previous glaciations were shorter).
- Near the last glacial maximum, 20,000 years ago.
Temperature scale
Surface air temperature is plotted as anomalies (differences) from the average over the reference interval 1960–1990 (which is about 14°C / 57°F), in both Celsius (left) and Fahrenheit (right).
Data
Panel 1: 540 to 65 million years ago
The panel 1 data is from stable oxygen isotope measurements from the shells of macroscopic marine organisms, collected by Veizer et al (1999),[1] as re-interpreted by Royer et al (2004).[2] The graph effectively reproduces the upper panel of Royer et al's figure 4, but with an expanded range (see below). The orange band shows the effect of extreme assumptions in application of the GEOCARB reconstruction to interpretation, and is not representative of the full uncertainly (which would be much larger).
Because the Royer and Veizer results are indicative of the temperature of the shallow tropical and subtropical seas where the organisms lived,[2] they are unlikely to be fully representative of global average surface air temperature variation. The anomalies are plotted here expanded by a factor of two, as a very approximate conversion. Multiple confounding factors affect interpretation of samples this old, so panel 1 is best viewed as a qualitative indication of temperature (warmer/colder).[3]
Panel 2: 65 to 5.3 million years ago
This data is from the Hansen et al (2013)[4] interpretation of the global collection of oxygen isotope data from microscopic marine organisms of Zachos et al (2008).[5]
This is a direct estimate of global average sea surface temperature, a close analogue of surface air temperature. Hansen et al describe it as a "first estimate", meaning an approximate one, but limited independent corroboration (e.g. Zachos et al (2006)[6] for the Eocene optimum) indicates that it is substantially more quantitative than panel 1.
Panel 3: 5.3 to 1 million years ago
This data is from the Lisiecki and Raymo (2005)[7][8] global stack of oxygen isotope data from microscopic marine organisms interpreted using the Hansen et al (2013)[4] prescription.
At this scale, the Zachos et al stack (which also covers this interval) is virtually indistinguishable from the Lisiecki and Raymo stack. This is a direct estimate of global average sea surface temperature.
Panel 4: 1 million to 20,000 years ago
Two datasets are plotted:
- Lisiecki and Raymo, as in panel 3.
- Temperature estimates from stable hydrogen isotope measurements from the EPICA Dome C ice core from central Antarctica[9] These temperature anomaly estimates are polar, not global, and are here divided by a standard polar amplification factor (2.0, as for example in Hansen et al (2013)[4]) to approximately convert them to global estimates.
Panel 5: 20,000 years ago to present (2015)
Five datasets are plotted:
- EPICA Dome C, as in panel 4.
- Temperature estimates from oxygen isotope measurements on the north Greenland ice core, NGRIP,[10] interpreted using the simple procedure of Johnsen et al (1989).[11] (There are more modern and complex procedures which would yield slightly different interpretations.) Like the EPICA Dome C record, this record is polar, and is shown divided by a polar amplification factor of 2.0. The difference between this and dataset 1. illustrates the polar sea-saw hypothesis.
- Global temperature estimates over the ~12,000 years of the Holocene from the multi-proxy collection and interpretation of Marcott et al (2013).[12]
- Instrumental (not proxy) data since 1850 from the Berkeley Earth project land-ocean dataset (2014),[13] plotted as decadal means.
- Projected temperatures for 2050 and 2100 from the IPCC Fifth Assessment Report's WG1 Summary for Policy Makers (2013)[14] for the RCP8.5 scenario.
Open source
The Microsoft Excel spreadsheet that produced this image is available here: All_palaeotemps.xlsx. Archived from the original on 2022-01-20. Retrieved on 3 May 2014..
References
- ↑ Veizer, J., Ala, D., Azmy, K., Bruckschen, P., Buhl, D., Bruhn, F., Carden, G.A.F., Diener, A., Ebneth, S., Godderis, Y., Jasper, T., Korte, C., Pawellek, F., Podlaha, O. and Strauss, H. (1999) 87Sr/86Sr, d13C and d18O evolution of Phanerozoic seawater. Chemical Geology 161, 59-88.
- ↑ a b Royer, Dana L. and Robert A. Berner, Isabel P. Montañez, Neil J. Tabor, David J. Beerling (2004) CO2 as a primary driver of Phanerozoic climate GSA Today July 2004, volume 14, number 3, pages 4-10, doi:[[doi:10.1130%2F1052-5173%282004%29014%3C4%3ACAAPDO%3E2.0.CO%3B2|10.1130/1052-5173(2004)014<4:CAAPDO>2.0.CO;2]]
- ↑ Royer, Dana (23 March 2014). Dana Royer comment at RealClimate. RealClimate.
- ↑ a b c Hansen, J., Mki. Sato, G. Russell, and P. Kharecha, 2013: Climate sensitivity, sea level, and atmospheric carbon dioxide. Phil. Trans. R. Soc. A, 371, 20120294. doi:10.1098/rsta.2012.0294
- ↑ Zachos JC, Dickens GR, Zeebe RE. 2008 An Early Cenozoic perspective on greenhouse warming and carbon-cycle dynamics. Nature 451, 279–283. doi:10.1038/nature06588
- ↑ Zachos, J. C., Schouten, S., Bohaty, S., Quattlebaum, T., Sluijs, A., Brinkhuis, H., Gibbs, S. & Bralower, T. J. (2006). Extreme warming of mid-latitude coastal ocean during the Paleocene-Eocene Thermal Maximum: Inferences from TEX86 and isotope data. Geology, 34(9), 737-740.
- ↑ Lisiecki, L. E., & Raymo, M. E. (2005). A Pliocene-Pleistocene stack of 57 globally distributed benthic δ18O records. Paleoceanography, 20(1).
- ↑ Lisiecki, L. E.; Raymo, M. E. (May 2005). Correction to "A Pliocene-Pleistocene stack of 57 globally distributed benthic d18O records". Paleoceanography: PA2007. doi:10.1029/2005PA001164
- ↑ Jouzel, J., Masson-Delmotte, V., Cattani, O., Dreyfus, G., Falourd, S., Hoffmann, G., ... & Wolff, E. W. (2007). EPICA Dome C ice core 800kyr deuterium data and temperature estimates. IGBP PAGES/World Data Center for Paleoclimatology data contribution series, 91, 2007.
- ↑ Andersen, K. K., Azuma, N., Barnola, J. M., Bigler, M., Biscaye, P., Caillon, N., ... & White, J. W. C. (2004). High-resolution record of Northern Hemisphere climate extending into the last interglacial period. Nature, 431(7005), 147-151.
- ↑ Johnsen, S. J., Dansgaard, W., & White, J. W. C. (1989). The origin of Arctic precipitation under present and glacial conditions. Tellus B, 41(4), 452-468.
- ↑ Marcott, S. A., Shakun, J. D., Clark, P. U., & Mix, A. C. (2013). A reconstruction of regional and global temperature for the past 11,300 years. Science, 339(6124), 1198-1201.
- ↑ Berkeley Earth land-ocean dataset (2014). Retrieved on 21 March 2014.
- ↑ IPCC Fifth Assessment Report WG1 Summary for Policy Makers (2013).
See also

Lisanslama
- Şu seçeneklerde özgürsünüz:
- paylaşım – eser paylaşımı, dağıtımı ve iletimi
- içeriği değiştirip uyarlama – eser adaptasyonu
- Aşağıdaki koşullar geçerli olacaktır:
- atıf – Esere yazar veya lisans sahibi tarafından belirtilen (ancak sizi ya da eseri kullanımınızı desteklediklerini ileri sürmeyecek bir) şekilde atıfta bulunmalısınız.
- benzer paylaşım – Maddeyi yeniden düzenler, dönüştürür veya inşa ederseniz, katkılarınızı özgünüyle aynı veya uyumlu lisans altında dağıtmanız gerekir.
Dosya geçmişi
Dosyanın herhangi bir zamandaki hâli için ilgili tarih/saat kısmına tıklayın.
| Tarih/Saat | Küçük resim | Boyutlar | Kullanıcı | Yorum | |
|---|---|---|---|---|---|
| güncel | 21.25, 27 Kasım 2025 | 1.800 × 500 (130 KB) | Mrmw | cleaned code, generated structured multilang (en, ms) | |
| 12.33, 20 Nisan 2024 | 1.760 × 513 (136 KB) | Hakimi97 | File uploaded using svgtranslate tool (https://svgtranslate.toolforge.org/). Added translation for ms. | ||
| 12.02, 24 Eylül 2021 | 1.760 × 513 (126 KB) | Mikhail Ryazanov | lc "planet" (not a proper noun); real minuses instead of hyphens | ||
| 09.37, 26 Nisan 2014 | 1.760 × 513 (126 KB) | Perhelion | per diss: text: manual kerns removed, defs cleaned, Inkscape code removed; | ||
| 10.04, 11 Nisan 2014 | 1.760 × 513 (388 KB) | Glen Fergus | font -> Liberation sans, several glitches fixed | ||
| 19.12, 7 Nisan 2014 | 1.766 × 514 (151 KB) | Perhelion | fix font | ||
| 04.38, 3 Nisan 2014 | 1.765 × 512 (1,93 MB) | Glen Fergus | Fix fonts. | ||
| 23.38, 21 Mart 2014 | 1.766 × 514 (349 KB) | Glen Fergus | Background, non-Inkscape file type | ||
| 23.29, 21 Mart 2014 | 1.766 × 514 (380 KB) | Glen Fergus | Trim to outline | ||
| 23.21, 21 Mart 2014 |  | 2.105 × 1.488 (349 KB) | Glen Fergus | {{Information |Description ={{en|1=SVG version of All_palaeotemps_rev7.png}} |Source ={{own}} |Author =Glen Fergus |Date =2014-03-22 |Permission = |other_versions =All_palaeotemps_rev7.png }} |
Dosya kullanımı
Bu görüntü dosyasına bağlantısı olan sayfalar:
Küresel dosya kullanımı
Aşağıdaki diğer vikiler bu dosyayı kullanmaktadır:
- bs.wikipedia.org üzerinde kullanımı
- ca.wikipedia.org üzerinde kullanımı
- cs.wikipedia.org üzerinde kullanımı
- de.wikipedia.org üzerinde kullanımı
- en.wikipedia.org üzerinde kullanımı
- es.wikipedia.org üzerinde kullanımı
- fr.wikipedia.org üzerinde kullanımı
- hy.wikipedia.org üzerinde kullanımı
- mk.wikipedia.org üzerinde kullanımı
- ms.wikipedia.org üzerinde kullanımı
- pl.wikipedia.org üzerinde kullanımı
- ro.wikipedia.org üzerinde kullanımı
- ru.wikipedia.org üzerinde kullanımı
- sl.wikipedia.org üzerinde kullanımı
- sv.wikipedia.org üzerinde kullanımı
- vi.wikipedia.org üzerinde kullanımı
- www.wikidata.org üzerinde kullanımı